The Gold Silver Ratio
The Gold silver ratio is the ratio between the price of gold versus silver. Simply stated, it’s the price of gold divided by the price of silver, and it shows the required ounces of silver needed to purchase one ounce of gold. It operates as a measure of relative value between the two metals and can help identify when one is expensive (or not) compared to the other.


Why Investors Care About the Ratio
Relative Value
Long-term investors monitor this ratio as a means of identifying whether to purchase gold or silver. These savvy investors will evaluate the current level of the ratio compared to its historical levels and make a decision as to whether one metal is less expensive than the other. If silver is expensive (the ratio is low) they will buy gold. Conversely, if silver is cheap (the ratio is elevated) they will buy it instead of gold.
Some investors have created an investment system from this concept which we touch on this below. This system, historically, has allowed investors to earn a higher rate of return on the precious metals holdings.
The Dow Gold Ratio
One alternative is the Dow gold ratio. Instead of measuring the relative value of silver vs gold, the Dow gold ratio measures the relative value between the Dow Jones Industrial Average and gold.
Knowing the different values of these two very different assets can help investors make longer-term allocation decision. For example, does it make more sense to invest in precious metals or the stock market?
Signaling Important Turning Points
Although both precious metals and thought of similarly, gold and silver each have different “personalities”. Although both metals fall under the precious metal umbrella, each is used in numerous different industries and purposes. Due to their massive price/oz difference, gold is a tool of central banks, wealthy consumers, and institutional investors. Whereas silver, due to its significantly lower price, is more readily used in industry and favored by smaller investors.
The differing profile of each metal’s typical buyer causes each metal to behave in its own way. In other words, their multi-year price patterns maintain a high correlation but in the short-term their paths can diverge. For example, gold tends to be much less volatile than silver. Furthermore, silver can move in dramatic price spikes whereas gold tends to trend more smoothly over time.
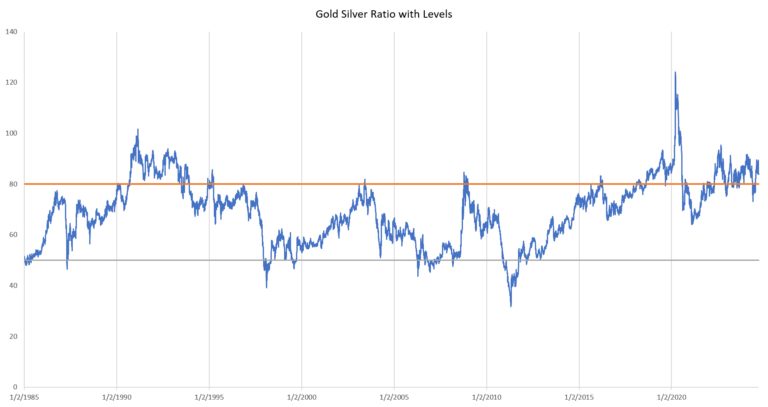
Interesting research from Goehring & Rozencwajg showed that the gold silver ratio tends to collapse when an upward price trend in precious metals reaches a period of exhaustion. Notable examples include April 1987, May 2011, June 2016 and September 2020. Keeping this tendency in mind may be of value in the future.
History of the Gold Silver Ratio
The gold silver ratio has stayed mostly confined to the 33 – 100 range over the past 40 years. This narrow oscillating band creates a stable relationship that many investors value and rely on.
However, the ratio’s range expanded in the years prior to 1980 and it’s unclear if those levels will be revisited in the future. Unlike today, this early time frame was muddied by fixed price levels and the volatility that accompanied the years following when the dollar-gold peg dissolved. Due to this, it seems likely that the stable price relationship will continue as long as both markets are able to trade freely.
Gold & Silver Switching Strategy
The gold silver ratio trades within a well-defined range and has done so since the early 1980s. Some investors have used this ratio to extract an additional rate of return from the precious metals investment.
By switching their investment from one metal to the other at certain levels of the ratio, they’ve taken advantage of the changes in relative value. For example, if they own gold and silver becomes comparably inexpensive they’ll then sell their gold and buy silver instead. Should the gold silver ratio subsequently move to a level indicating that gold is inexpensive relative to silver they would then sell their silver and buy gold.
Countless variations of this system exist, but one simple option would be to use the levels of 80 and 50 on the ratio. Specifically, should it decline to 50 then sell silver and use the proceeds to buy gold. Conversely, should it advance to 80 then sell gold and use the proceeds to buy silver.
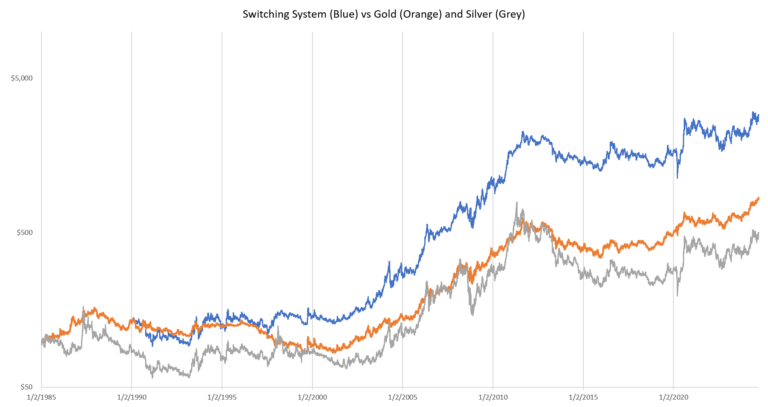
Using this specific method would have theoretically increased an investor’s initial stake of one ounce of gold (48.5 ounces silver) in 1985 to nearly 3.5 ounces of gold (288 ounces silver) in 2024. This example is purely illustrative and does not take into account any commissions, premiums, slippage, or any other real-world costs into account.
Above is an equity curve of an investor’s hypothetical performance. In this simulation an investor started with one ounce of gold in 1985 and switched at the respective times.

Author
Andrew McCormick, RIA is the Senior Portfolio Manager at Cottonwood Capital Management. Previously, he worked for BlackRock and managed the MKC Global Fund, LP. Andrew’s work has been featured in ZeroHedge, TheStreet, and the Wall Street Journal.

